2017
Florida’s Fireprints: Examining a Decade of Fire Activity through a Spatial Lens
Most people know that fire plays two essential roles in the environment. It can be beneficial to the health of landscapes, plants, and wildlife in our natural environment and it can cause wildfire-related harm to community health or property in our built environment. As part of a broader research initiative, this project took a unique approach to examining the relationship between prescribed fire and wildfire: looking at it through a spatial lens.
Using data accessed through an agreement with the Florida Forest Service, we analyzed statewide fire data from 2004 to 2014 across Florida’s public and private lands. In this project, we used new space-time pattern mining tools to investigate and visualize a decade of fire activity on forested lands in Florida.
We examined the relationship between prescribed fire and wildfire in two ways. First, we used a time series analysis (examining data over time) to look at the potential for prescribed fire activity to predict wildfire activity and to frame some of the classic theories on fire seasonality. Second, we transformed the data into 3D space-time cubes and performed a spatial hotspot analysis (examining data over time and across the state) to improve our understanding of how each of these fire types occur in Florida in relation to each other and in relation to community growth.
Fire Patterns and Predictions
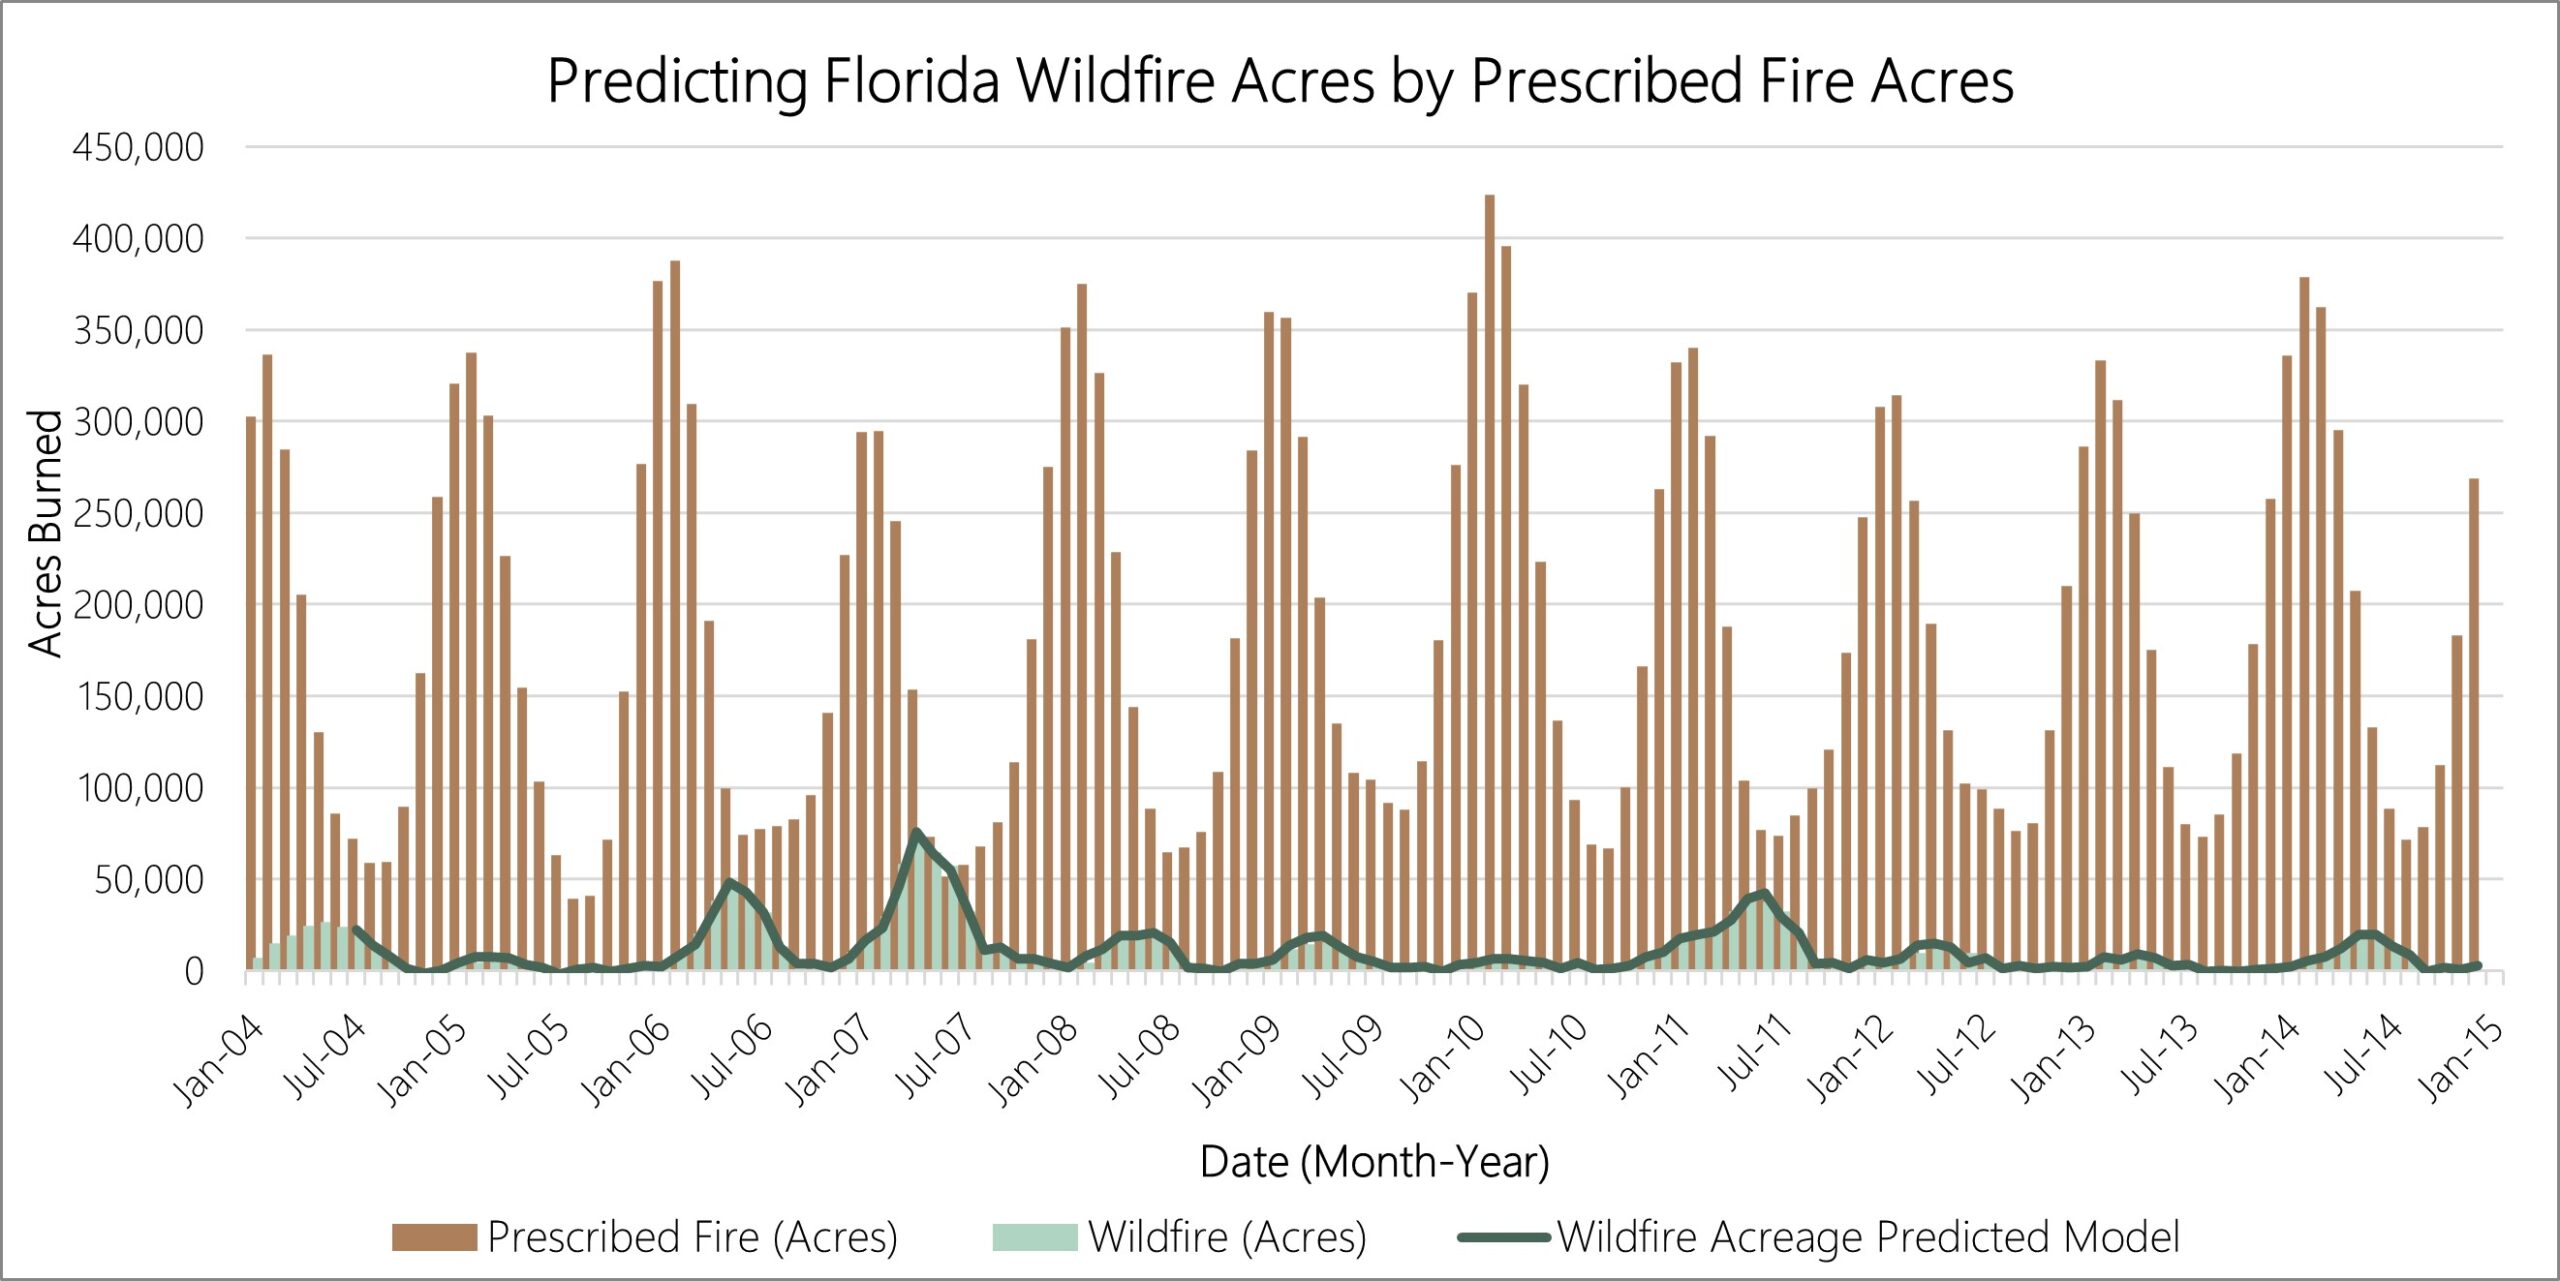
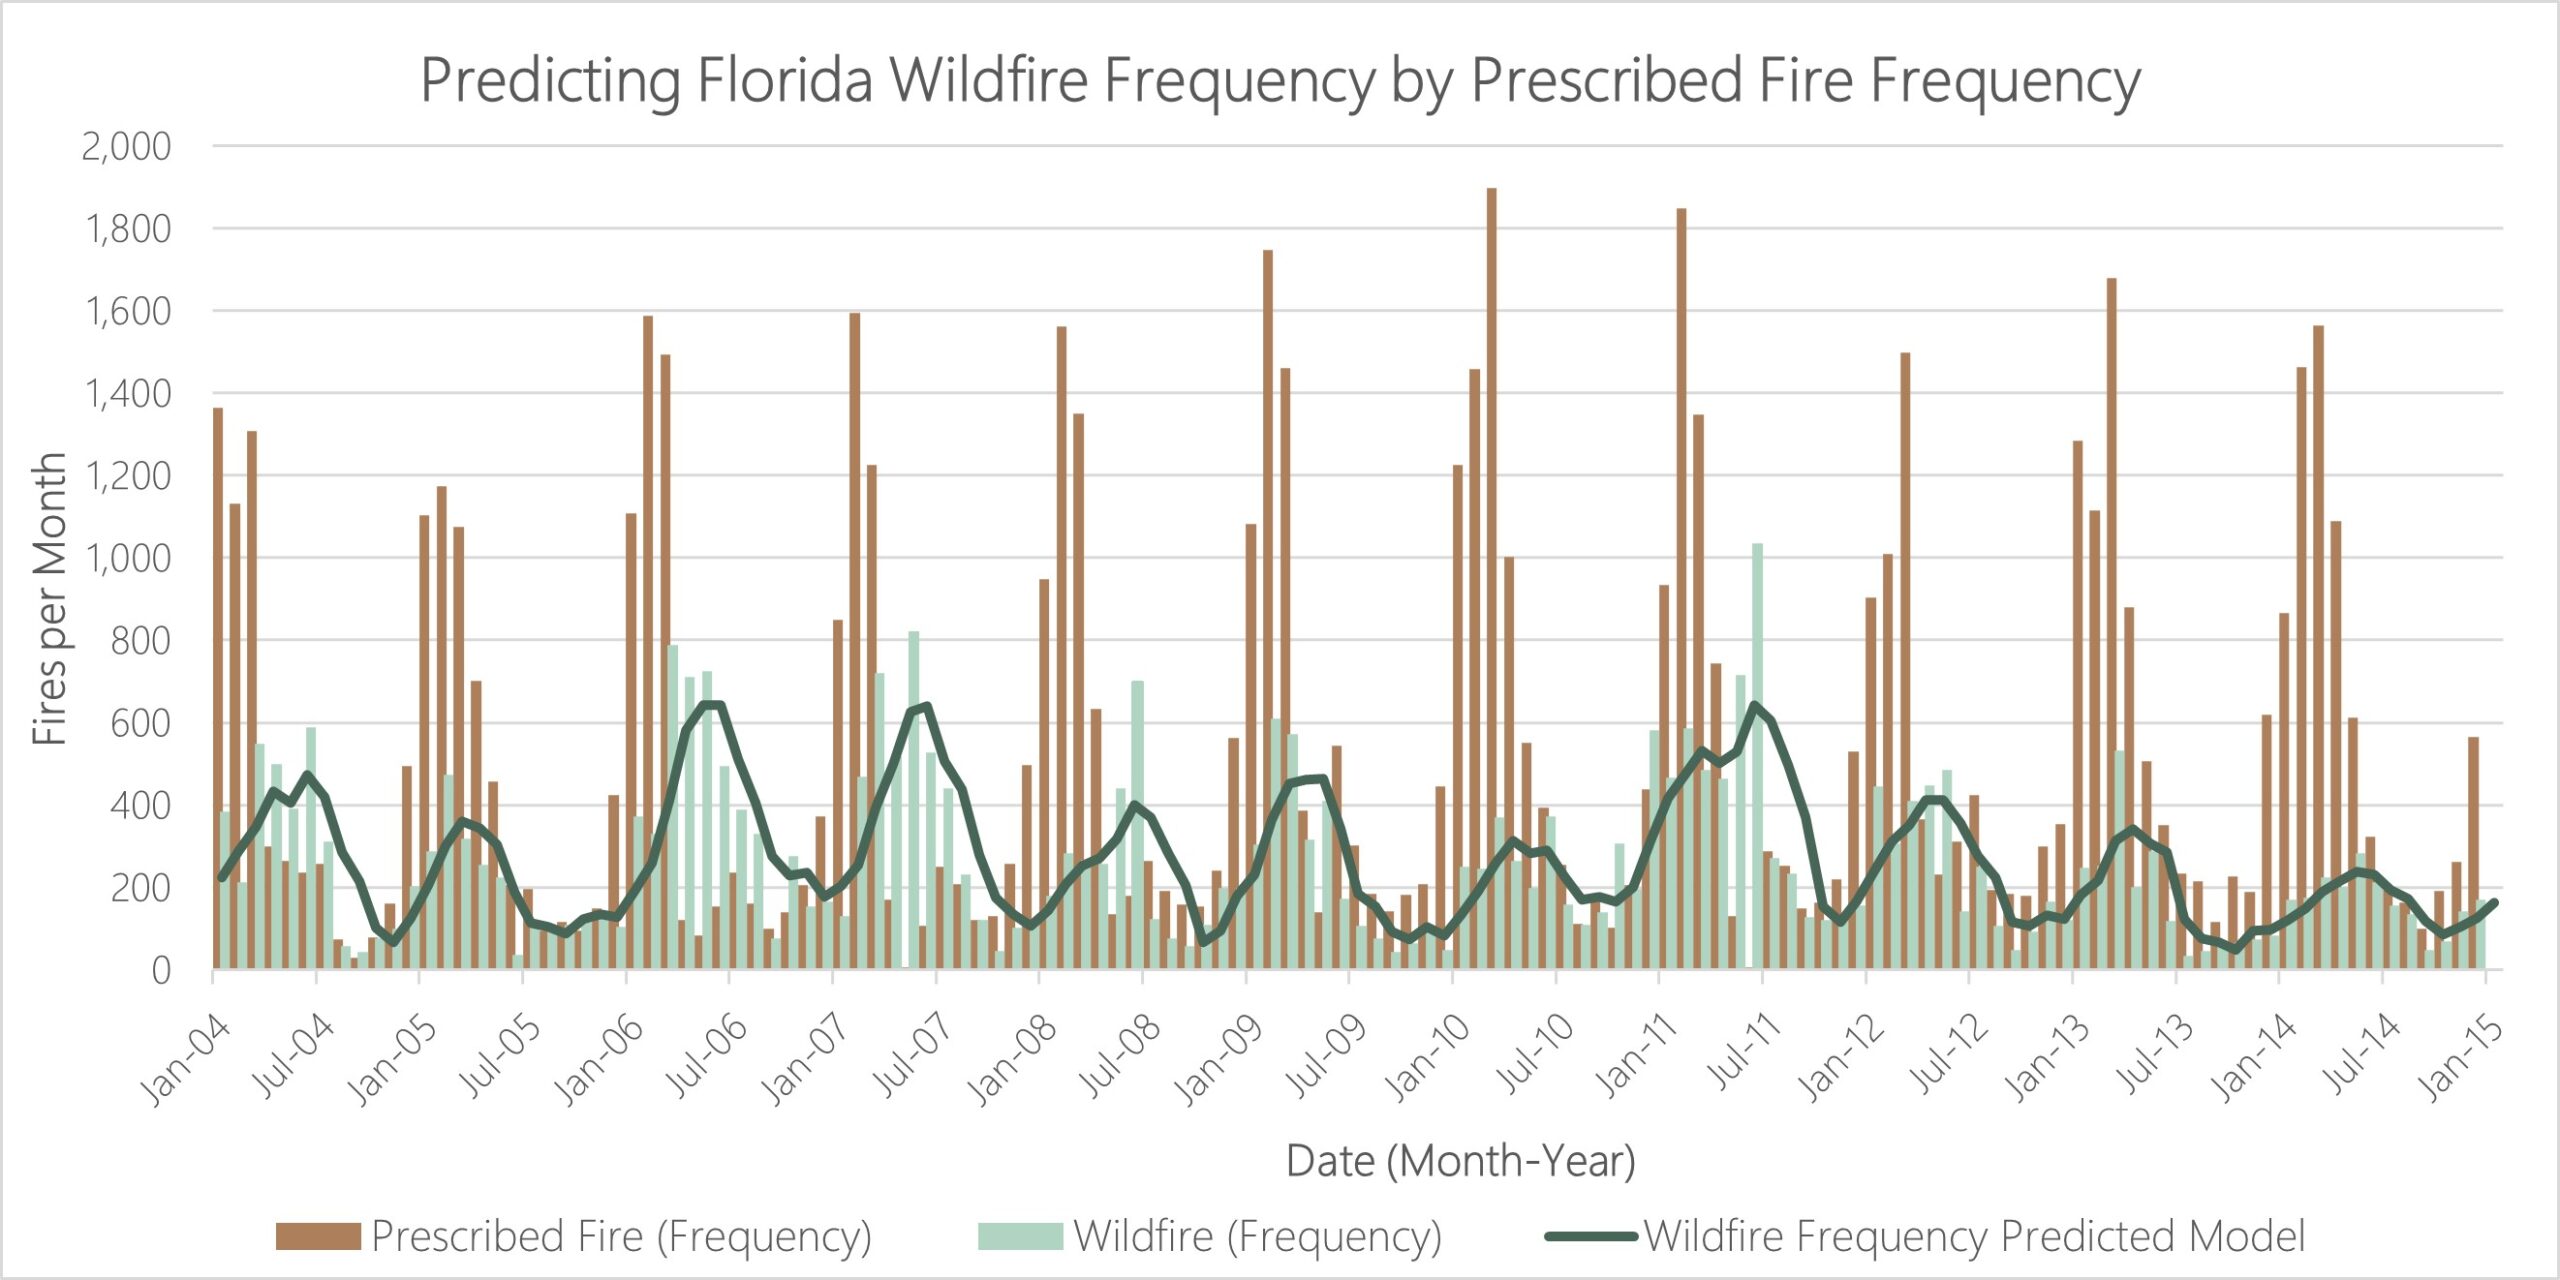
The study found that a four-month moving average of prescribed burn frequency was the best predictor of wildfire frequency, explaining over 95% of wildfire occurrences. This study explored predictive potential using both count of fires per month (fire frequency) and acres burned per month (areal extent information). The intent was to determine if there were differences in predictions between prescribed fire and wildfire when looking at incidences versus when looking at acreage. The results were comparable to similar, more robust studies that also included other variables like drought conditions.
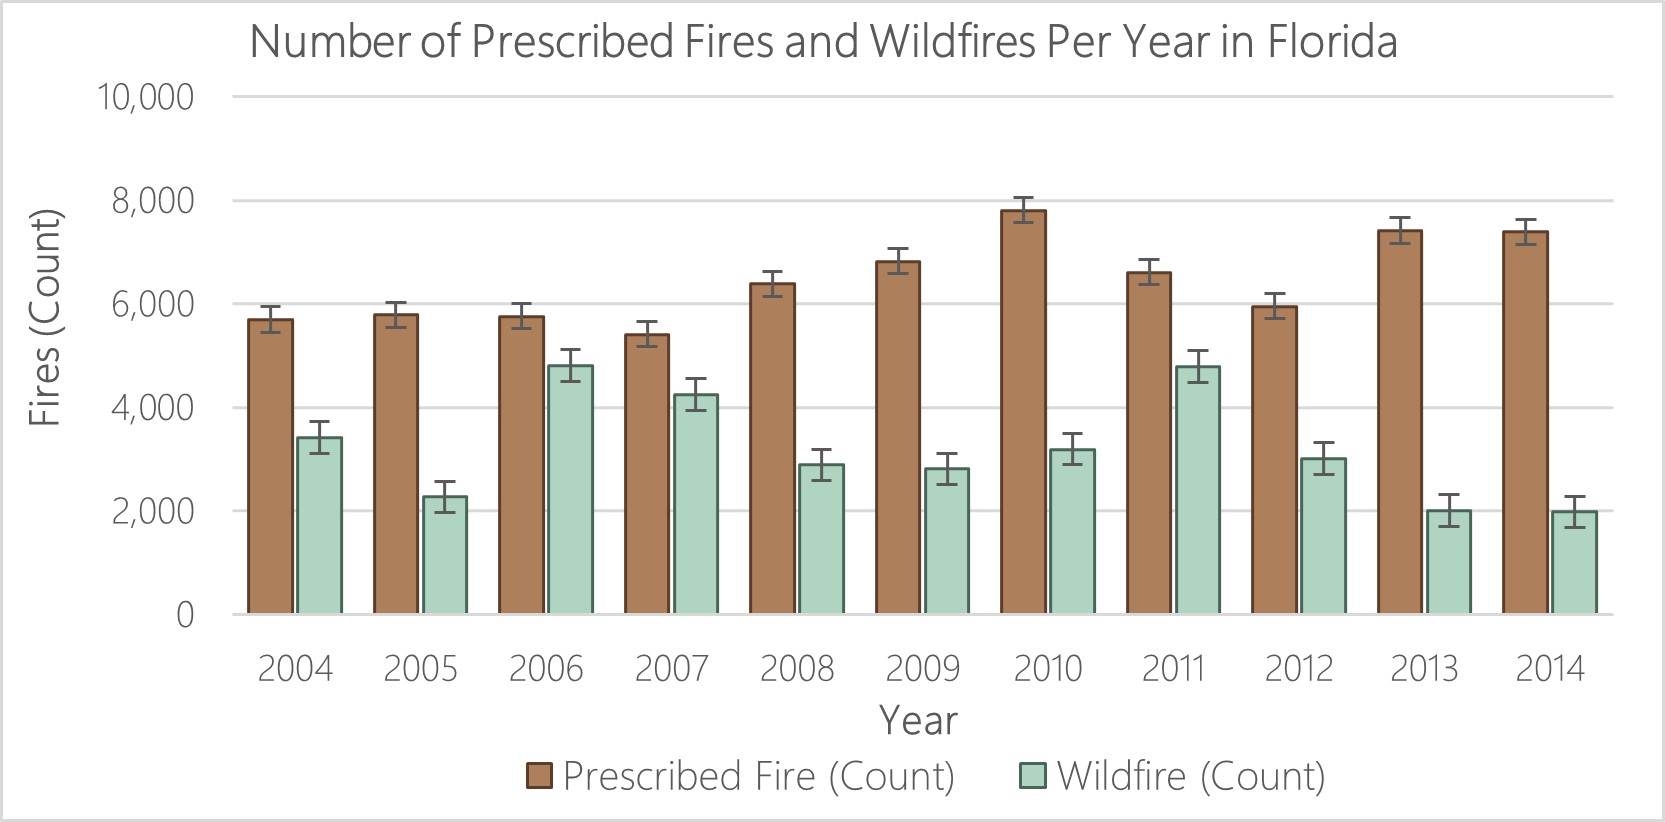
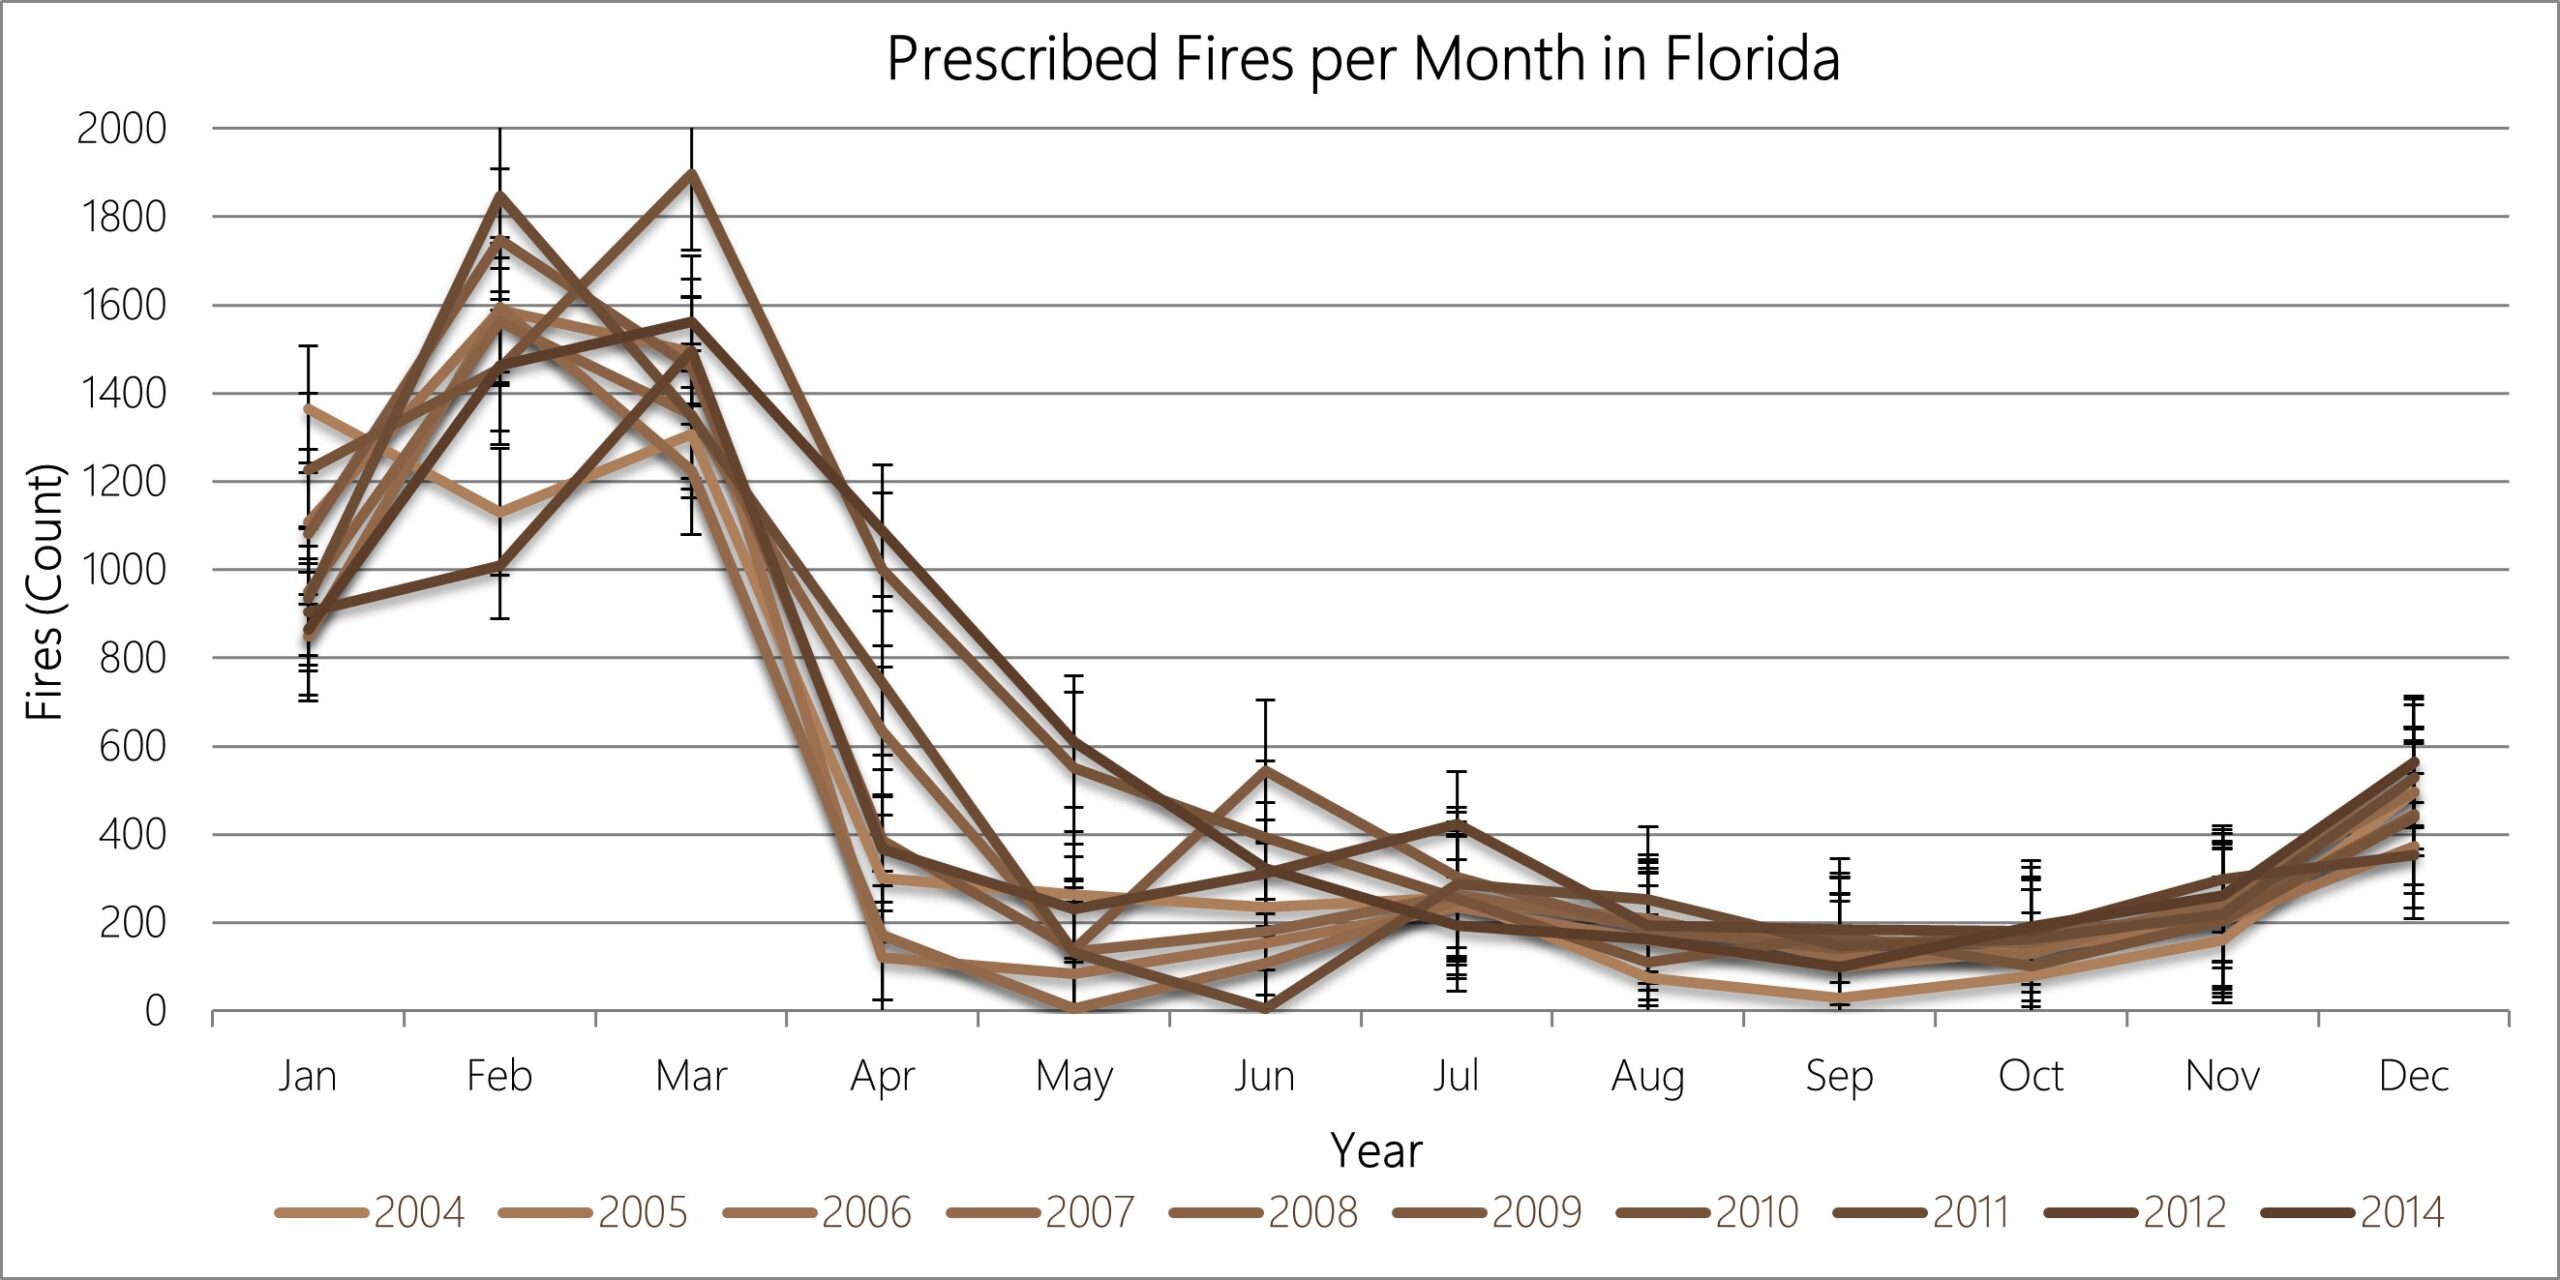
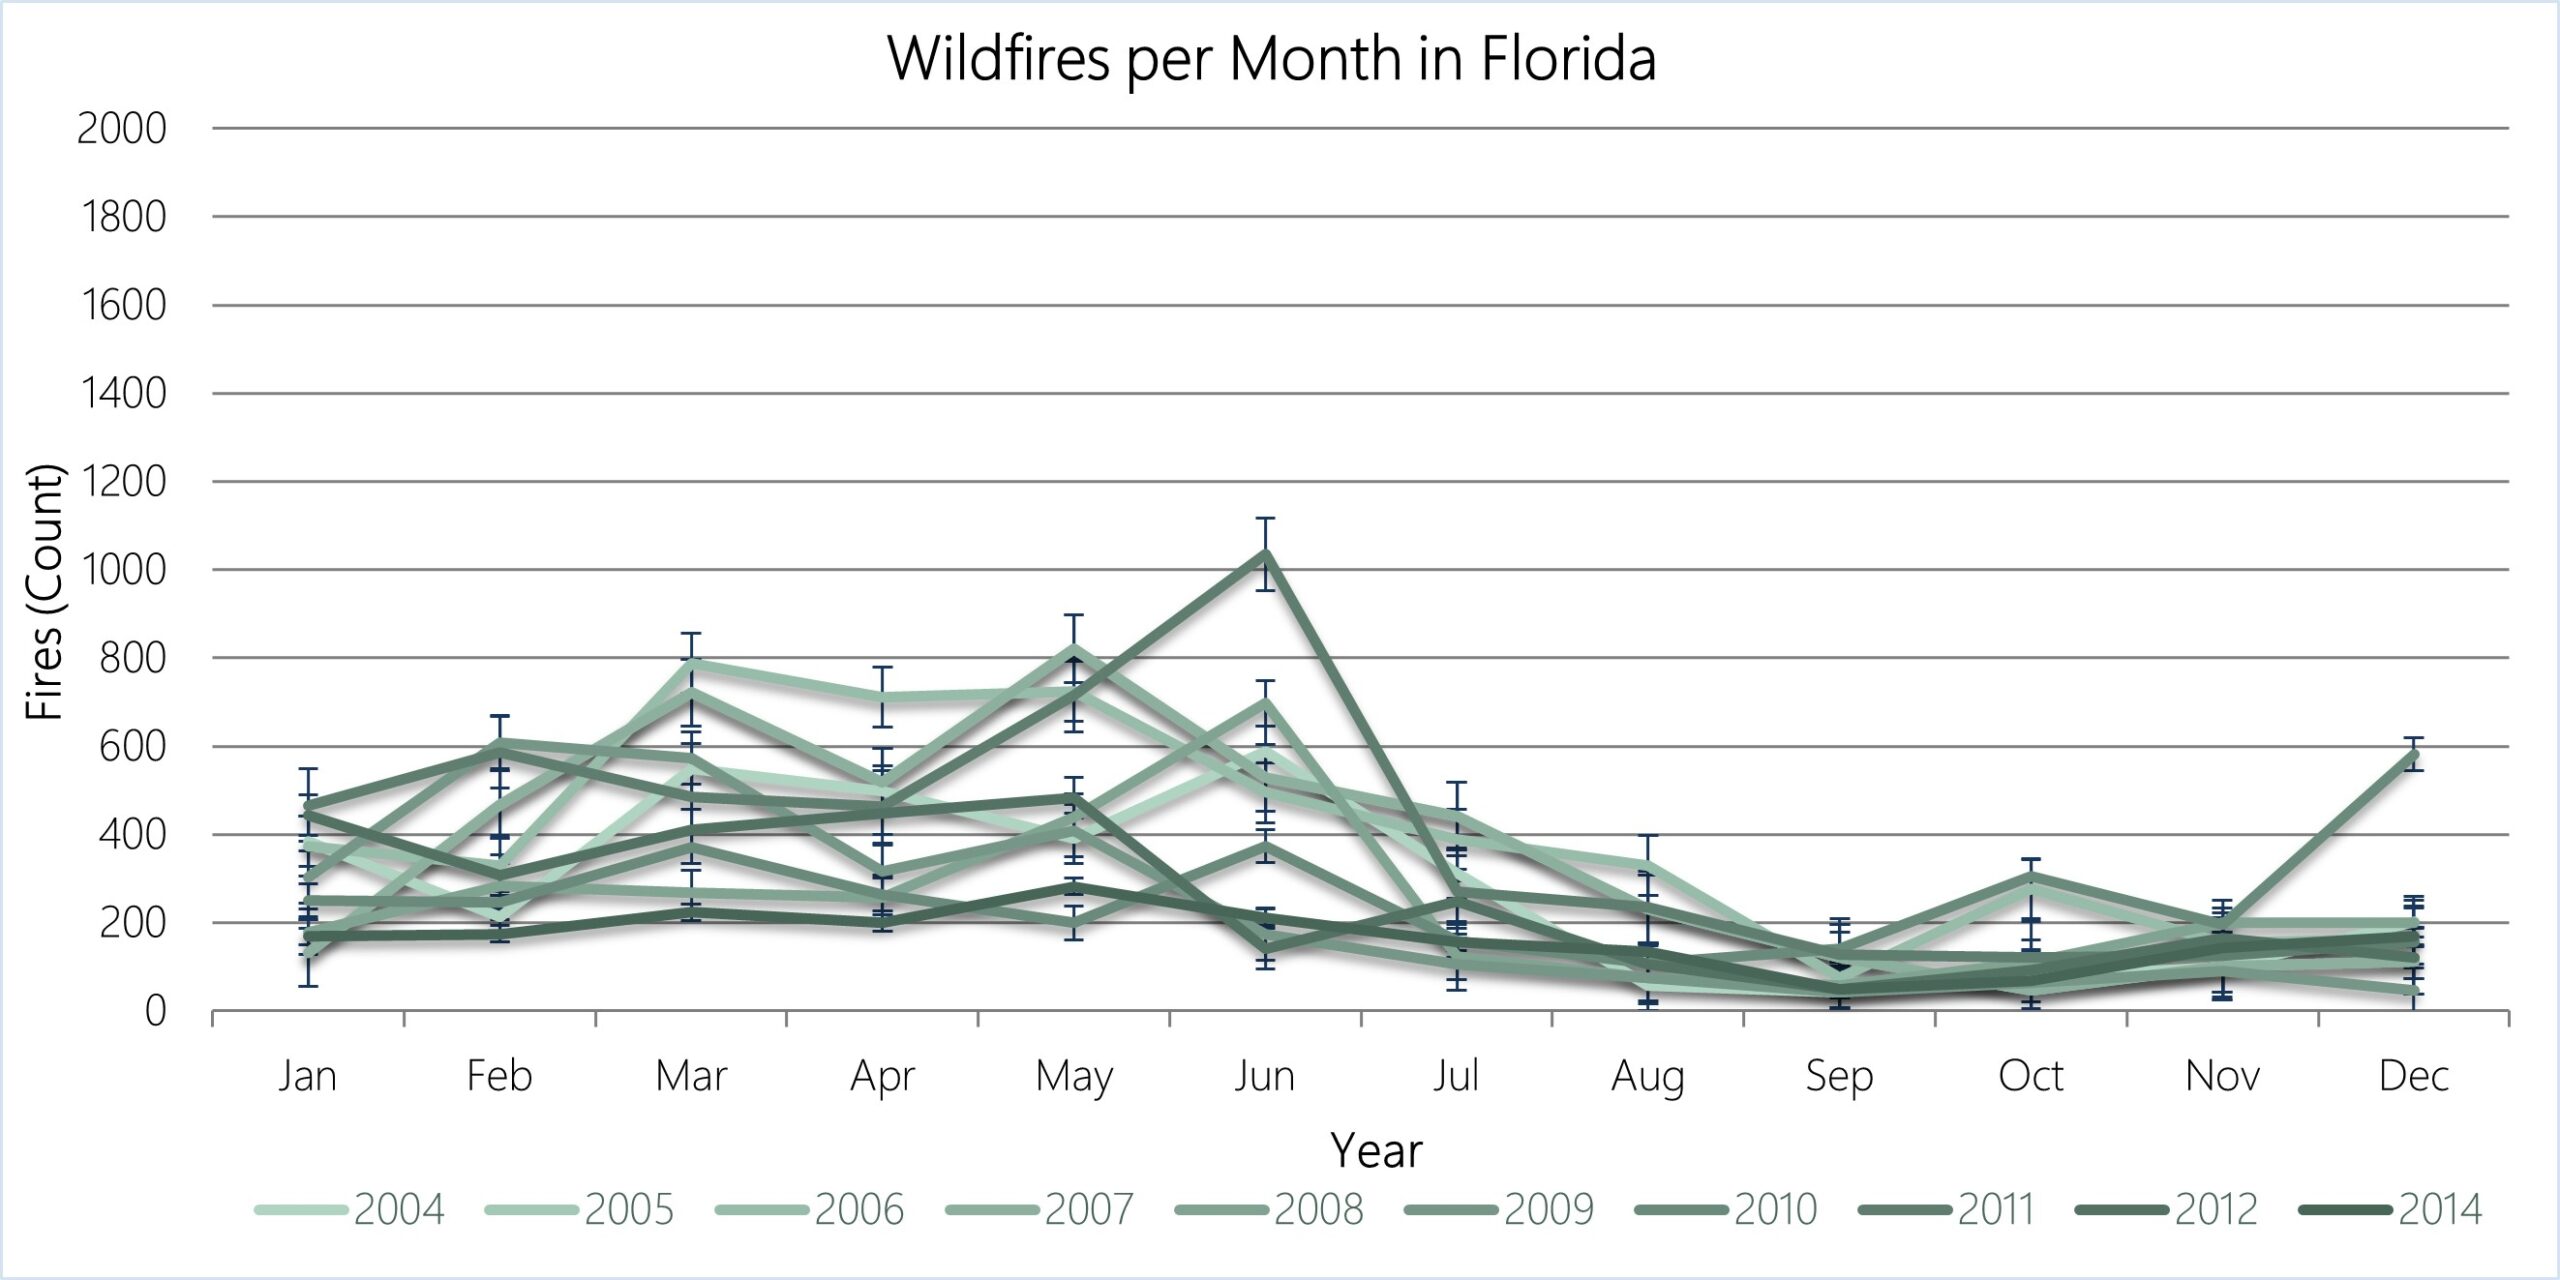
We present several graphics from the time series analysis from most complex to least complex. Looking at fire month-by-month offers significantly more insight into Florida’s fire seasons. Through this, we see patterns like the prescribed fire season (historically late fall to early spring) and the natural wildfire season (historically late spring through summer). We also see how these patterns are potentially shifting over time due to our changing climate.
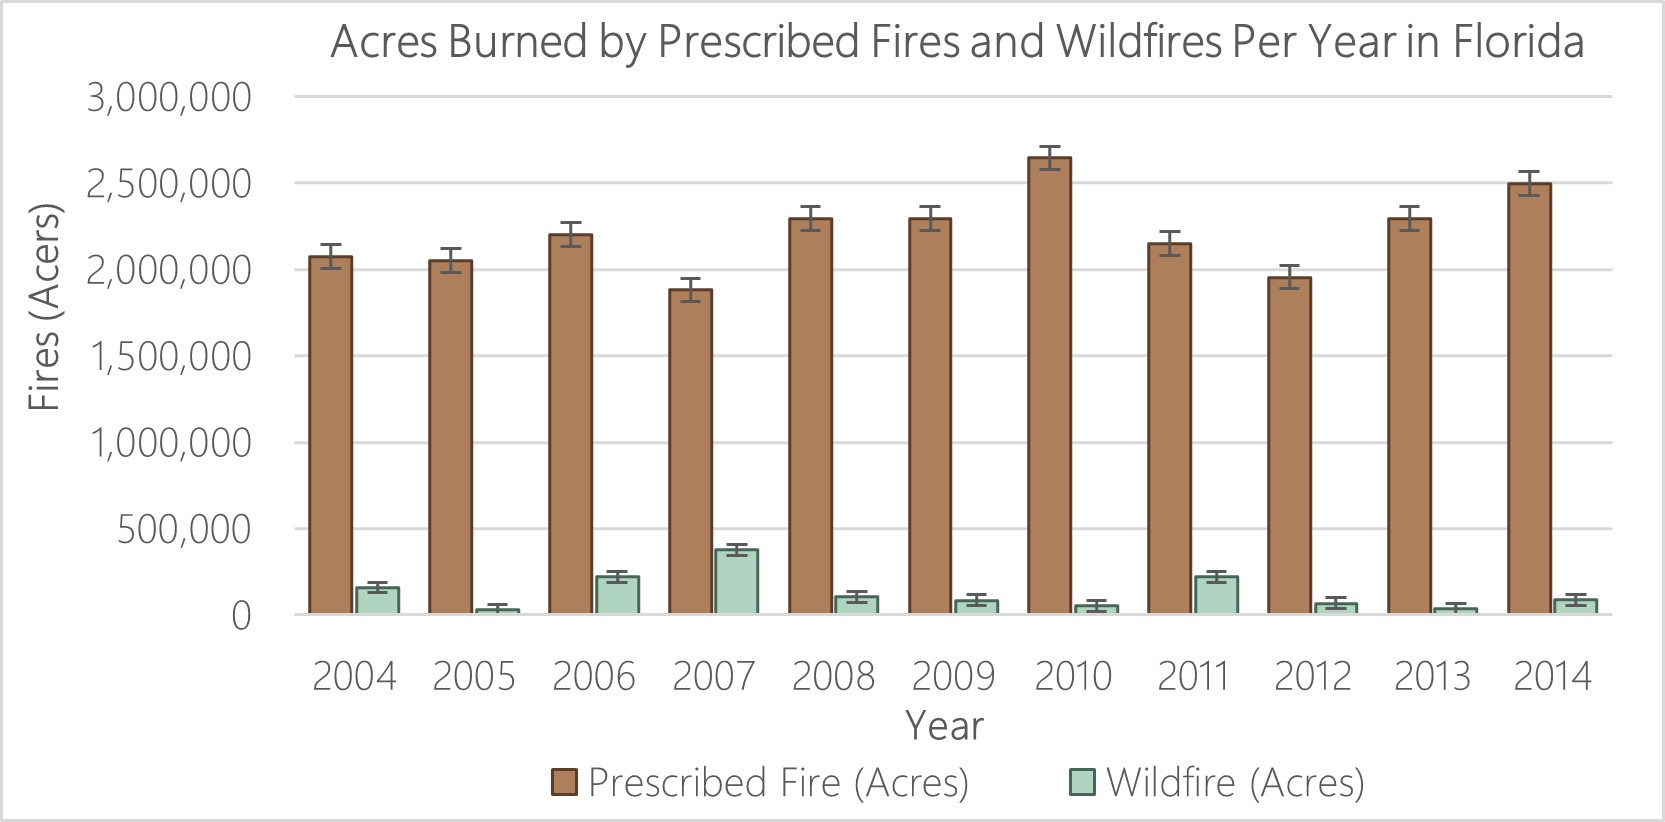
Annual totals can also be enlightening. In the time frame of our study the average acreage burned per year by prescribed fire in Florida was 2.2 million acres, and the average acreage burned per year by wildfire was 140,000 acres. In 2011 over 7.8 million acres were burned by prescribed fire in forests and grasslands in the US, and, of those, in 2011 Southeastern land managers reported burning over 6.4 million acres (USDA 2012; Melvin 2012; Kobziar et al. 2015), making Florida a leader in prescribed fire use in the United States (FFS 2017).
Mapping Fire Hotspots through Time
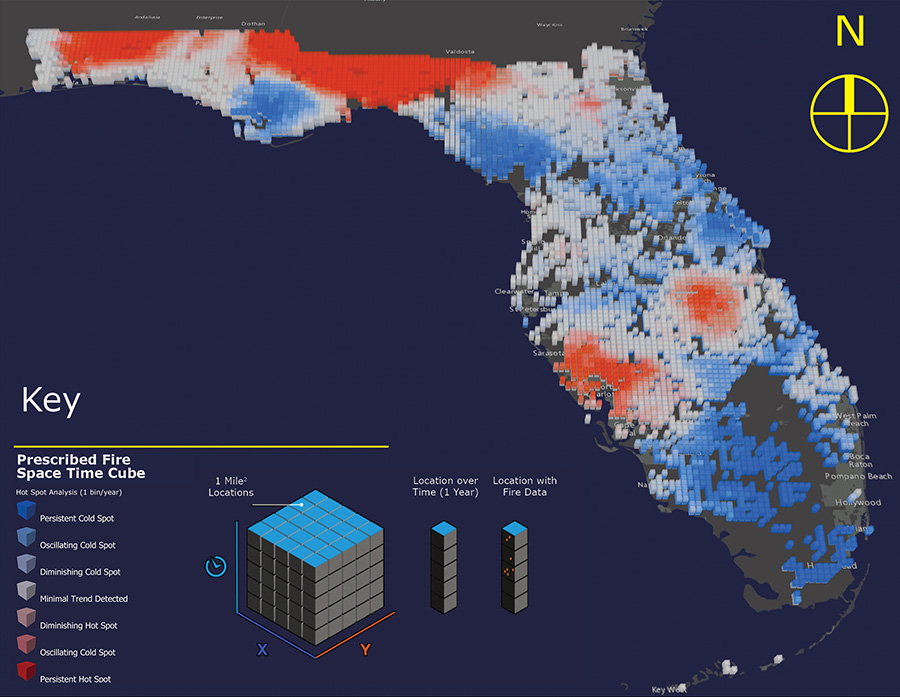
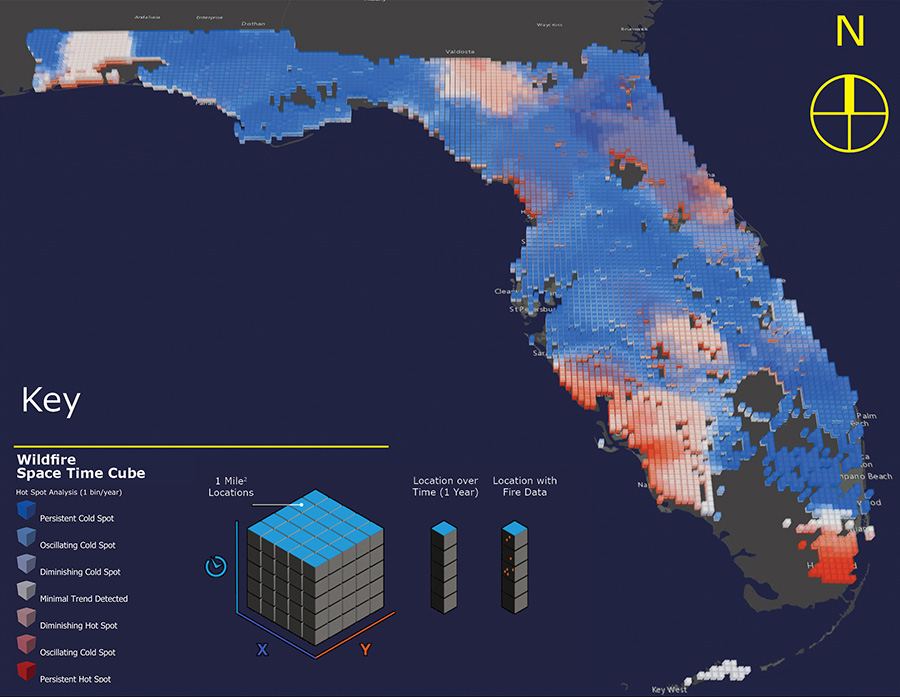
A hotspot analysis is a great spatial tool for highlighting areas of high activity and low activity. In our visuals we used the classic scheme of red for “hotspots” and blue for “coldspots”, with each cube representing 1 square mile and 1 calendar year. Through a 3D lens, we were able to visualize a decade of fire use in the State to see where fire activity is consistent through time and compare this to areas where fire activity is becoming more common or less common. Regions like the Redhills near Tallahassee, the Myakka area near Sarasota, and the Black Creek and Yellow Water Creek regions near Jacksonville stood out for prescribed burns during the 10-year period. We can compare this to areas like Homestead, Avon Park, and Big Cypress which had high wildfire activity relative to the State.
An exciting outcome of looking at a decade of fire activity through a spatial lens is a deeper understanding of areas where wildfires are decreasing (wildfire coldspots forming) and where prescribed fire use is expanding (prescribed fire hotspots forming). The Jacksonville region is just one unique example of wildfire activity because in the early years of the dataset there was a large hot spot, and in recent years the hot spot has started to transition into an area of insignificant statewide wildfire activity.
Moving Forward with Fire Management
One of the goals of this study was to take existing data and create visuals that would support discussions among land managers. One of the most common reasons for developing a prescribed burn program is to reduce fuels in the hopes of reducing wildfire incidence, acreage burned, or the severity of wildfires. We strongly convey that the results of this study do not show that prescribed fire directly reduces wildfire occurrences. Instead, we observe that certain areas across Florida have land managers using significantly more prescribed fire than their neighbors. We hope this study encourages discussions on why and under what conditions land managers choose to use fire as a management tool so that others can learn.
This is an important topic in Florida as our communities continue to expand into wildlife habitat that has evolved to be resilient to fire. Ultimately, prescribed fire and wildfire each have roles in Florida’s land management. By understanding how they interact, we hope that land managers can make better decisions to protect both natural habitats and human communities.
Client: Florida Forest Service
Services: Spatial Analytics and Site Mapping
Role: Lead Researcher, Supervised by the University of Florida Department of Urban and Regional Planning and the University of Florida School of Forest Resources and Conservation
Location: Gainesville, Florida


